
International Year of Plant Health 2020: Utilization of Satellite Imageries for Precise and Sustainable Crop Physiological Status Monitoring
Abstract
Adapted agricultural management and corrective actions at the right times consist of very important measures relevant to preserving a healthy plant growing cycle, which would eventually reduce the yield gap. However, this is most likely to be complex and challenging as stress detection appears in most cases to be unachievable, at least at near-real time basis on a regional scale.
From this viewpoint, the purpose of this article is to first, highlight the significant advances that have been occurring, particularly in utilizing remotely sensed data to acquire information on crops over wide regional scale. Second, to globally illustrate various remote sensing applications on agriculture, particularly in keeping track of the plant physiological status, which is nevertheless correlated with the plant health, taking the advantage that this year (2020) is the plant health year, as declared by the Food and Agriculture Organization of the United Nations (FAO).
Within the scope of the European Space Agency (ESA) Sentinel missions, Synthetic Aperture Radar (SAR) and optical satellites, we hereby illustrate the estimation, calculation and mapping of different indicators and biophysical factors that are related directly and/or indirectly to the plant health status. The applications represented in this paper are related to:
- Leaf chlorophyll content, which is estimated directly from indices that are retrieved from the remote sensing optical data.
- Crop phenology monitoring, which is determined by modelling the remote sensing SAR data temporal dynamics with Gaussian model.
- Soil water content computation, which is estimated from the backscattering amplitude of the SAR data.
- Plant evapotranspiration and water consumption, which are calculated using an energy balance model.
- Drought detection, which is achieved from indices that compute anomalies in Normalized Difference Vegetation Index (NDVI) from deep temporal series behavior. NDVI is computed from optical remote sensing data.
- The use of remote sensing biophysical variables to feed and improve crop growth models’ outputs (e.g. LAI, NDVI, ET, etc.).
The investment in remote sensing technology, therefore, is feasible to survey crops and food production. Looking at the different challenges and stresses coming from different sources, taking actions is required more than ever to keep global food security under control.
Introduction
The United Nations General Assembly declared 2020 as the International Year of Plant Health (IYPH). This year is a once in a lifetime opportunity to raise global awareness on how protecting plant health can help end hunger, reduce poverty, protect the environment, and boost economic development (http://www.fao.org/plant-health-2020). According to the Food and Agriculture Organization of the United Nations (FAO), around 40% of food crops are abolished due to pests and diseases every single year, leaving millions of people without enough food, and thus putting the global food security, especially for poor rural communities, in real danger.
Plant pests and diseases are hardly eradicated, especially when not diagnosed at the right time, leading to a very costly management, which is often not feasible. Thus, identifying plant health status at the right time on a large scale is very critical to reduce losses.
In this context, the interest in remote sensing technology has been significantly rising in the recent years, due to its applicability over large and heterogeneous agricultural areas (Nasrallah et al., 2018). Remote sensing basically means acquiring information of an object on ground by a sensor (i.e. ground-based, airborne or spaceborne). The two most used spaceborne satellites are passive (optical) and active (radar) sensors. The optical sensors are usually sensitive to weather conditions (i.e. clouds), as their operation mode consists on registering the reflected sunlight over a short wavelength (between ~ 490 nm and ~ 2280 nm), consisting of several bands in the visible light range, near infra-red, thermal, etc. While on the other hand, radar satellites operate by sending a signal with long wavelength (between ~ 3 cm and ~ 23 cm) and receiving the backscattering from the ground, thus clouds are never an obstacle, however, the characteristics of the surface highly influence the signal amplitude (i.e. surface moisture and surface roughness).
In the last 6-7 years, the European Space Agency (ESA) has made some enormous advancements in remote sensing technology with the launching of the radar satellite Sentinel-1 (Sentinel-1A and Sentinel-1B launched on the 3rd of April 2014 and the 25th of April 2016, respectively) and the optical satellite Sentinel-2 (Sentinel-2A and Sentinel-2B launched on the 2nd of June 2015 and the 6th of March 2017, respectively), which are pioneer satellites in many published and on-going studies around the globe on applied remote sensing. The main interests in these platforms are basically the free of charge data, in addition to the high temporal (5 days for Sentinel-2 and 6 days for Sentinel-1, notably in Europe) and spatial (10m) resolutions. In addition, the spatial coverage of this data is huge, a Sentinel-1 image covers an area of ~ 250 km x ~ 160 km, while a Sentinel-2 image covers an area of ~ 110 km x ~ 110 km.
Hence, relying on remotely sensed data as those coming from Sentinel-1 and Sentinel-2 is highly feasible to monitor crops on large scales rather than counting on in-situ sensors, which are highly expensive and adapted to very small scales (i.e. canopy or field scale). Regarding their operational use, optical and radar platforms have been intensively used in environmental and agronomic studies, ranging from crop classification maps production to climate change, water use, crop monitoring and health indicators retrieval. Therefore, to grab the opportunity, few applications directly related to plant health are illustrated in this paper.
Chlorophyll content estimation
The chlorophyll content is a significant indicator of stresses, notably nitrogen deficiencies (ESA, 2016). Consequently, the chlorophyll content is strongly related to nitrogen content (Dmitrieva et al., 1995), and hence is a very good reflector of the plant physiological status.
From space, the chlorophyll content can be measured at both scales, leaf and canopy, by multiplying the leaf chlorophyll content by the leaf area index (LAI) (Fig. 1). Hence, remote sensing data can provide information, which are location specific of chlorophyll content as a proxy of the crop nitrogen (N) status in order to help farmers with an optimal in-season timing of N application (Elarab et al., 2015). The developed remote sensing techniques to estimate the chlorophyll content are either based on radiative transfer inversion models and/or empirical and semi-empirical spectral vegetation indices (Daughtry et al., 1999). In this context, various studies have shown that these two ratio indices can be easily applied using the high-resolution Sentinel-2 data, or Sentinel-2-like-data. One example of what is mentioned previously in estimating leaf chlorophyll content (LCC) is the ratio of the transformed chlorophyll in reflectance index and the optimized soil-adjusted vegetation index (TCARI/OSAVI). As for estimating the canopy chlorophyll content (CCC), it has been found that the red-edge band region, which can be obtained from Sentinel-2 product, is very important to give an indication on the leaf nitrogen status. Thus, for this purpose, Gitelson et al. (2003) has presented the “red-edge chlorophyll index”, which is a simple index based on the near-infrared and the red-edge bands. Nevertheless, in the same study, another version of this index (green chlorophyll index) has been presented, yet instead of the red-edge band, green band was used, resulting in an index of 10m spatial resolution (i.e. finer final product) , if Sentinel-2 data were used.
Phenology monitoring
To ensure a healthy crop, it is very important to understand each of the dynamics leading to attain each phenological phase. Monitoring the crop’s phenological cycle is thus highly vital for farmers and decision makers regarding the required interventions (i.e. irrigation, fertilization, pesticides application and produce handling and management) (Nasrallah et al., 2019).
Precipitation scarcity has been highly affecting winter crops, especially in arid and semi-arid areas, thus supplementary irrigation applications are needed to secure crop water demands (Zhang et al., 2008). However, it is very important to know the crop’s actual phenological phase to ensure high water use efficiency (WUE) and hence a better plant health. Similarly, it is very important to know the crop’s phenological phase for higher nitrogen use efficiency (NUE) and better results when applying pesticides/fungicides (Quemada et al., 2016). In addition identifying the actual phenological stage accurately, would assist in avoiding various consequences (e.g. increased fungal diseases and stem lodging). Thus, to ensure plant health, understanding the physiological cycle of the crops is necessary.
A minor number of studies have significantly relied on heavy time-series Sentinel-1 (SAR) data for monitoring the phenology of different types of crops (Veloso et al., 2017; Baghdadi et al., 2009).
In this context, recent studies have focused on retrieving the whole crop cycle using dense SAR time series data at different configurations (Fig. 2), derived from space, in order to find significant dynamic to be used in developed models to capture the time of the occurrence of the most important phenological stage. Unlike those derived from optical satellites, Synthetic Aperture Radar (SAR) data have shown significant dynamic, related to the crop growth cycle (Nasrallah et al., 2019). For the case of wheat, for instance, SAR data have shown significant dynamic through a Gaussian model to identify, temporally, at least three growth phases (i.e. germination, heading and soft dough) in addition to the harvesting time. Figure 2 show a Gaussian modeling of the evolution of RSO backscatter over time for a wheat plot. Inflection points are imposed in the Gaussian modeling curve and that of RSO backscattering by the start of the different phenological stages. These inflection points were automatically captured by signal analysis, and the phonologies stage germination, heading and soft dough were determined (Nasrallah et al., 2019).
As the European Space Agency (ESA) has launched its first Sentinel satellite, free-of-charge data have become available for operational use. Starting April 2014, when Sentinel-1A first became available, multi-temporal series SAR data became available at high spatial resolution (10m). As Sentinel-1B was then launched in April 2016, the temporal resolution then increased from 12 to 6 days of revisit time. As the planned continuity of Sentinel data until 2030 is ensured, free and accurate uninterrupted crop monitoring will continue to take place.
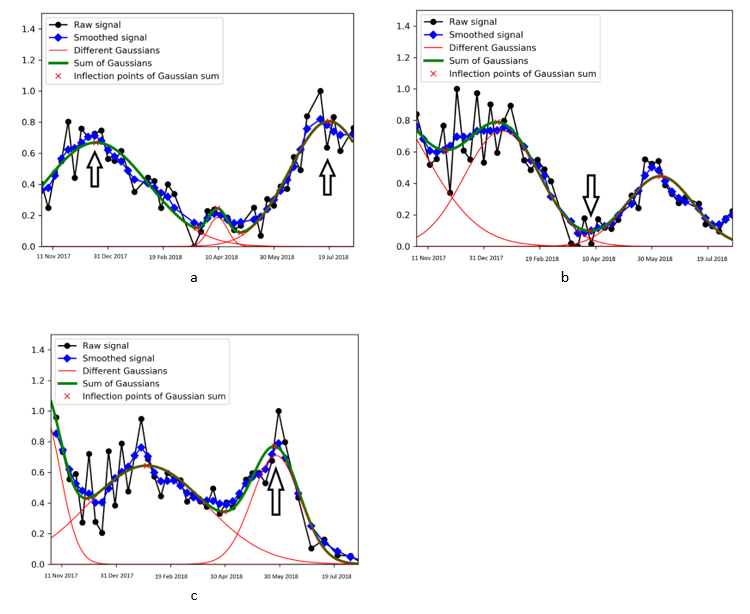
Figure 2: Temporal profile of a wheat plot showing the dynamic of the SAR signal extracted from Sentinel-1 over the Berkaa region, Lebanon (Nasrallah et al., 2019). a) VV/VH polarization ratio and black arrows indicate the inflection points where germination phase and harvesting event had taken place. b) VV polarization and black arrow indicates the inflection point where heading phase had taken place. c) VH polarization and black arrow indicates the inflection point where grain filling phase had taken place. (Nasrallah et al., 2019).
Soil water content
Soil water content (SWC) and its availability to support plant growth is a key factor in yield productivity. Soil-atmosphere interactions and dynamics of water fluxes from the phreatic water underneath yields two distinguishable zones of SWC: the surface SWC of the first few centimeters (5 to 7 cm), and the root zone SWC which is colonized by the below-ground biomass. Root zone SWC scarcity can result in yield loss or plant death, whereas too much water in the root zone causes root diseases. Given that surface SWC is physically related to the root zone through diffusion processes (Mahmood et al., 2007; 2012), monitoring surface SWC is a plant health indicator.
SAR remote sensing were widely and preliminary used to estimate surface SWC since the radar backscattering amplitude is sensitive to the variation of the soil moisture level (SAR backscattering is more significant as surface SWC increases) (Baghdadi et al., 2012). Numerous studies showed that the surface SWC can be mapped from SAR data with an RMSE of around 5 Vol.% (Srivastava et al., 2009; Baghdadi et al., 2012; Zribi et al., 2005). As limitations, when the canopy cover is high (NDVI > 0.7), the retrieval of underlying surface SWC is impossible since the emitted SAR wave is completely attenuated by dense vegetation cover (with high canopy water content). Finally, very rough soil, which is usually not the case of many crops, especially wheat and soybeans, leads to inaccurate surface SWC estimation from SAR data.
Since the arrival of Sentinel-1A/B, researchers have been pushed to develop operational methods to mapping SWC from space, leading to frequent surface SWC mapping (at least one image available each 6 days over Europe) at plot scale (Figs 3 & 4) (El Hajj et al., 2017). Examples of SWC products can be easily accessed (https://www.theia-land.fr/en/product/soil-moisture-with-very-high-spatial-resolution).
Evapotranspiration estimation
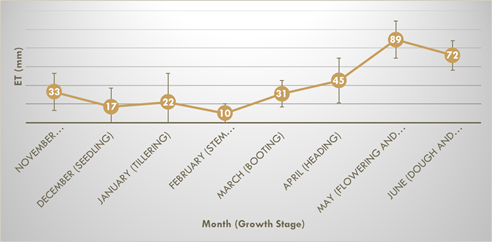
Evapotranspiration (ET) is one of the water cycle’s most important component and has been intensively studied in various disciplines (e.g. hydrology, agriculture, and climate) (Mhawej et al., 2020). Measuring ET is significant to evaluate the status of the plant-water interaction and hence insuring healthy plant physiological status. However, the means of direct measurements of ET are on one hand relatively few (e.g. flux towers) and complicated/expensive on the other hand. Hence, attention has been rising on the use of remote sensing techniques and satellite products to ensure continuous, uncut observations and monitoring (Trambauer et al., 2014).
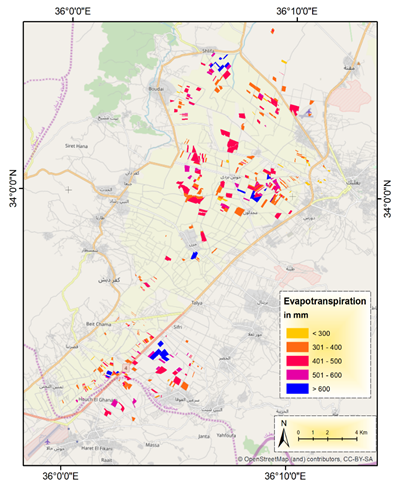
Recently, satellite-based ET products have been remarkably pushed forward and have been seen very promising in filling the in-situ observational gaps, despite that, ET cannot be measured directly from satellite-based products (Senay et al., 2013; Miralles et al., 2015). Instead, using physical variables (i.e. latent and surface heat fluxes) of surface energy balance model, ET from space is estimated. Consequently, remote-sensing-derived ET (Figs. 5 & 6) cannot be interpreted as direct satellite observations and should instead be construed as surface energy balance model outputs based on satellite forcing data (Weerasinghe et al., 2020).
In this context, several surface energy balance algorithms to estimate ET have been proposed (e.g. Surface Energy Balance Algorithm for Land (SEBAL) (Bastiaanssen et al., 1998a; 1998b), Mapping EvapoTranspiration at High Resolution using Internalized Calibration (METRIC) (Allen et al., 2007), Surface Energy Balance Index (SEBI), Surface Energy Balance System (SEBS) (Su, 2002), and ET-Watch.
The main goal behind estimating plant ET using these proposed algorithms is to assess the plant health by calculating crop water requirements, retrieving productivity at plot scale and calculating water productivity and its corresponding score.
Drought detection
Drought is a natural phenomenon that occurs due to a prolonged period of less than average precipitation amounts in a particular area, characterized by a severity level that varies depending on the weather conditions, land cover and geolocation. As it takes place, drought imposes an abiotic stress on crops, characterized by a reduced soil moisture, eventually leading to significant yield drop in most cases.
To maintain plant health, crops must be monitored, especially in drought weather/periods to take any corrective measures to ensuring high yield at the end of the cropping season. However, monitoring many parcels at regional scale might be not feasible, as monitoring daily precipitation, air temperature and air relative humidity might not be always enough to assess the plant health status during a drought period.
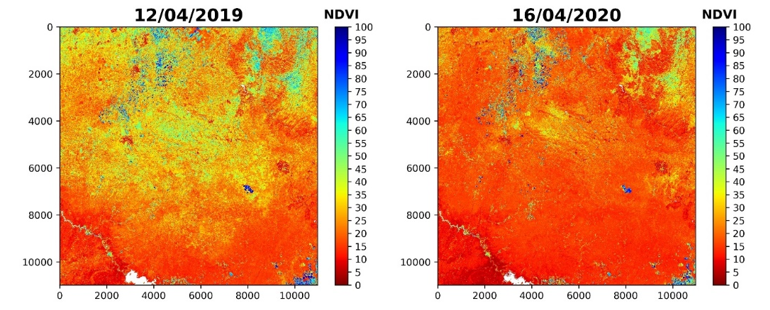
In this context, remote sensing technology can be a major asset due to its ability in providing spatial and temporal variability. In this framework, optical remote sensing, precisely the Normalized Difference Vegetation Index (NDVI), has been used widely to assess whether a cultivation is going through a drought stress, with its ability, nevertheless, to predict up to what level the crop has been damaged, as it is well correlated with the vegetation photosynthetic activity. As an example, the figure below (Fig. 7) shows the NDVI-derived-Sentinel-2 maps, for 2019 and 2020, for the same date over Morocco. In 2020, this area has been affected by a severe drought wave in 2020, unlike in 2019. By interpreting the NDVI values, one can clearly see that the vegetation is “healthier” in 2019 (NDVI > ~ 0.4) than that of 2020 (NDVI < ~ 0.2).
Hence, using optical images temporal series, several quantification indicators for drought severity have been proposed. These indicators are potentially operational and thus easy to be applied and put in service, since they only use remote sensing images. One of these indicators is the Vegetation Condition Index (VCI) (Kogan, 1995) that ranges between 0 and 100, as follows:
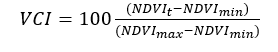
where NDVIt is the NDVI at a given date t, NDVImin is the multi-year NDVI minimum calculated using all available NDVI images for the month containing the date t, and NDVImax is the multi-year NDVI maximum calculated using all images from NDVI available for the month containing the date t.
For vegetated areas, the VCI varies from the case of a canopy in a dry state (VCI = 0) to a state of maximum development (VCI = 100). According to Amalo et al. (2017), two classes of drought could be determined: extreme to moderate drought: VCI≤20%; no drought: VCI> 20%
Crop growth models – remote sensing data assimilation
Crop growth models consist of a set of mathematical equations that simulate soil-plant-atmosphere interactions and give estimation of, and not limited to, plant parameters at daily time step (e.g. above ground biomass, evapotranspiration, soil moisture, etc.). To ensure satisfactory results, such models require a significant number of soil and vegetation variables as inputs, which are likely to be heterogenous even over small areas (for different crop types and soil conditions).
However, having such set of input variables on a regional scale is highly challenging. In-situ sensors/measurements are rather restricted due to small-scale variability, high time consumption, big budgets and the need of experts.
With the availability of high spatial and temporal resolution free-of-charge satellite data, acquiring information on a wide (regional) scale is thus feasible. The added value of remote sensing images use in crop models resides in the ability of these images to provide information on each plot or sub-plot within a particular image.
The most common remote sensing derived parameter, which can be used as an entry for the crop growth models, to improve the final model prediction, is the Leaf Area Index (LAI), which is related directly to the above ground biomass and final yield (Monteith, 2013). As the LAI is not derived directly from the satellite as a ratio of different parts of the wavelength as other indices (e.g. NDVI and SAVI), different ways of estimating the LAI from the satellite images have been proposed through the literature. Various studies have stated that the vegetation indices (basically the NDVI) can be good estimators of the LAI, which have been demonstrated using linear and non-linear models (Bsaibes et al., 2009). However, more recently, the use of different bands into a neural network models have decreased the uncertainty of the LAI estimations. Thus, by supporting the crop-model-simulated LAI by satellite-based LAI, the model prediction of the yield could be enhanced (Pinstrup-Andersen, 2000). In addition, extracting the LAI time-series at the plot scale could be used to calibrate the crop model to different environmental scenarios and increase outputs precision, as well as reducing error and induced bias.
Different crop growth models have been used to assess the plant growth, as well as monitoring its cropping cycle and estimating the system’s outputs (e.g. CropSyst, DSSAT, APSIM, CROPGRO, DAISY, WOFOST, STICS, Cropwin-ITK, …). However, calibrating the crop phenology is sometimes challenging and needs accurate in-situ recordings (Nasrallah et al., 2020). In this context, remote sensing, notably SAR data, have shown a high significance in monitoring the crop dynamic over the cropping season (Pinstrup-Andersen, 2000), allowing to estimate the time of some key phenological phases with satisfactory precision.
Modelling the canopy growth (using a crop growth model) from sowing to harvesting, with a certain precision, would certainly increase the chances to ensure a healthy crop with satisfactory productivity. However, the challenges lie in having an accurate monitoring. For this reason, as the model’s accuracy increases, thanks to remote sensing data assimilation, the crop is better monitored and hence the plant health remains under control.
Conclusion
Ensuring food security has been rising as a global issue. As plants are the primary source of food, securing a proper and healthy growth cycle is a must. However, due to the lack of precise information on crop health, a large portion of food is being lost, continuously, without being countified (Pinstrup-Andersen, 2000). From this perspective, plant health management is the science and action of understanding and withstanding different sources of stress (biotic and abiotic), which inhibit plants from attaining their potential growth.
In this context, remotely sensed data has shown a great potential, notably via physiological crop monitoring at plot scale in the recent years, following the launch of the Sentinel-1&2 missions. More specifically, researchers around the globe have been developing various operational-use methodologies serving different agricultural-oriented objectives, from crop classification and mapping, to growth monitoring, water consumption, and much more.
Indeed, remote sensing technology has become one of the very essential means towards more precise and sustainable way of agriculture, which would, thus, ensure global food security, preserve the environment, and most importantly, keep an “eye” on the plant health status.
Acknowledgements
The authors would like to thank the ITK family (notably the agronomy department), especially all those who made this work possible and publishable. In particular, the authors would like to express their gratitude to Vianney Houlès, Philippe Stoop, Carole Bécel, Serge Zaka, Claire Richert and Gaetan Leroux, for their significant contribution in reviewing and improving the quality of this paper.
References
- Allen, R.G., Tasumi, M., and Trezza, R. (2007). Satellite-based energy balance for mapping evapotranspiration with internalized calibration (METRIC)—Model. J. Irrig. Drain. Eng. 133, 380–394.
- Amalo, L.F., and Hidayat, R. (2017). Comparison between remote-sensing-based drought indices in East Java. In IOP Conference Series: Earth and Environmental Science, (IOP Publishing), p. 012009.
- Baghdadi, N., Boyer, N., Todoroff, P., El Hajj, M., and Bégué, A. (2009). Potential of SAR sensors TerraSAR-X, ASAR/ENVISAT and PALSAR/ALOS for monitoring sugarcane crops on Reunion Island. Remote Sens. Environ. 113, 1724–1738.
- Baghdadi, N., Cresson, R., El Hajj, M., Ludwig, R., and La Jeunesse, I. (2012). Estimation of soil parameters over bare agriculture areas from C-band polarimetric SAR data using neural networks. Hydrol. Earth Syst. Sci. 16, 1607–1621.
- Bastiaanssen, W.G., Pelgrum, H., Wang, J., Ma, Y., Moreno, J.F., Roerink, G.J., and Van der Wal, T. (1998a). A remote sensing surface energy balance algorithm for land (SEBAL).: Part 2: Validation. J. Hydrol. 212, 213–229.
- Bastiaanssen, W.G.M., Pelgrum, H., Wang, J., Ma, Y., Moreno, J.F., Roerink, G.J., and Van der Wal, T. (1998b). A remote sensing surface energy balance algorithm for land (SEBAL).: Part 2: Validation. J. Hydrol. 212, 213–229.
- Bsaibes, A., Courault, D., Baret, F., Weiss, M., Olioso, A., Jacob, F., Hagolle, O., Marloie, O., Bertrand, N., and Desfond, V. (2009). Albedo and LAI estimates from FORMOSAT-2 data for crop monitoring. Remote Sens. Environ. 113, 716–729.
- Daughtry, C.S.T., Walthall, C.L., Kim, M.S., De Colstoun, E.B., and McMurtrey Iii, J.E. (2000). Estimating corn leaf chlorophyll concentration from leaf and canopy reflectance. Remote Sens. Environ. 74, 229–239.
- Del Frate, F., Ferrazzoli, P., Guerriero, L., Strozzi, T., Wegmuller, U., Cookmartin, G., and Quegan, S. (2004). Wheat cycle monitoring using radar data and a neural network trained by a model. IEEE Trans. Geosci. Remote Sens. 42, 35–44.
- Delegido, J., Verrelst, J., Alonso, L., and Moreno, J. (2011). Evaluation of sentinel-2 red-edge bands for empirical estimation of green LAI and chlorophyll content. Sensors 11, 7063–7081.
- El Hajj, M., Baghdadi, N., Zribi, M., and Bazzi, H. (2017). Synergic use of Sentinel-1 and Sentinel-2 images for operational soil moisture mapping at high spatial resolution over agricultural areas. Remote Sens. 9, 1292.
- Elarab, M., Ticlavilca, A.M., Torres-Rua, A.F., Maslova, I., and McKee, M. (2015). Estimating chlorophyll with thermal and broadband multispectral high resolution imagery from an unmanned aerial system using relevance vector machines for precision agriculture. Int. J. Appl. Earth Obs. Geoinformation 43, 32–42.
- van Evert, F.K., Booij, R., Jukema, J.N., ten Berge, H.F., Uenk, D., Meurs, E.B., van Geel, W.C., and Wijnholds, K.H. (2012). Using crop reflectance to determine sidedress N rate in potato saves N and maintains yield. Eur. J. Agron. 43, 58–67.
- Gitelson, A.A., Gritz, Y., and Merzlyak, M.N. (2003). Relationships between leaf chlorophyll content and spectral reflectance and algorithms for non-destructive chlorophyll assessment in higher plant leaves. J. Plant Physiol. 160, 271–282.
- Kogan, F.N. (1995). Application of vegetation index and brightness temperature for drought detection. Adv. Space Res. 15, 91–100.
- Mahmood, R., and Hubbard, K.G. (2007). Relationship between soil moisture of near surface and multiple depths of the root zone under heterogeneous land uses and varying hydroclimatic conditions. Hydrol. Process. Int. J. 21, 3449–3462.
- Mahmood, R., Littell, A., Hubbard, K.G., and You, J. (2012). Observed data-based assessment of relationships among soil moisture at various depths, precipitation, and temperature. Appl. Geogr. 34, 255–264.
- Mhawej, M., Caiserman, A., Nasrallah, A., Dawi, A., Bachour, R., and Faour, G. (2020). Automated evapotranspiration retrieval model with missing soil-related datasets: The proposal of SEBALI. Agric. Water Manag. 229, 105938.
- Miralles, D.G., Jiménez, C., Jung, M., Michel, D., Ershadi, A., McCabe, M.F., Hirschi, M., Martens, B., Dolman, A.J., and Fisher, J.B. (2016). The WACMOS-ET project-Part 2: Evaluation of global terrestrial evaporation data sets. Hydrol. Earth Syst. Sci. 20, 823–842.
- Monteith, J.L. (1972). Solar radiation and productivity in tropical ecosystems. J. Appl. Ecol. 9, 747–766.
- Nasrallah, A., Baghdadi, N., Mhawej, M., Faour, G., Darwish, T., Belhouchette, H., and Darwich, S. (2018). A novel approach for mapping wheat areas using high resolution Sentinel-2 images. Sensors 18, 2089.
- Nasrallah, A., Baghdadi, N., El Hajj, M., Darwish, T., Belhouchette, H., Faour, G., Darwich, S., and Mhawej, M. (2019). Sentinel-1 Data for Winter Wheat Phenology Monitoring and Mapping. Remote Sens. 11, 2228.
- Nasrallah, A., Belhouchette, H., Baghdadi, N., Mhawej, M., Darwish, T., Darwich, S., and Faour, G. (2020). Performance of wheat-based cropping systems and economic risk of low relative productivity assessment in a sub-dry Mediterranean environment. Eur. J. Agron. 113, 125968.
- Pinstrup-Andersen, P. (2000). The future world food situation and the role of plant diseases. Can. J. Plant Pathol. 22, 321–331.
- Quemada, M., and Gabriel, J.L. (2016). Approaches for increasing nitrogen and water use efficiency simultaneously. Glob. Food Secur. 9, 29–35.
- Senay, G.B., Bohms, S., Singh, R.K., Gowda, P.H., Velpuri, N.M., Alemu, H., and Verdin, J.P. (2013). Operational evapotranspiration mapping using remote sensing and weather datasets: A new parameterization for the SSEB approach. JAWRA J. Am. Water Resour. Assoc. 49, 577–591.
- Shadchina, T.M., and Dmitrieva, V.V. (1995). Leaf chlorophyll content as a possible diagnostic mean for the evaluation of plant nitrogen uptake from the soil. J. Plant Nutr. 18, 1427–1437.
- Srivastava, H.S., Patel, P., Sharma, Y., and Navalgund, R.R. (2009). Large-area soil moisture estimation using multi-incidence-angle RADARSAT-1 SAR data. Geosci. Remote Sens. IEEE Trans. On 47, 2528–2535.
- Su, Z. (2002). The Surface Energy Balance System (SEBS) for estimation of turbulent heat fluxes. Hydrol. Earth Syst. Sci. 6, 85–99.
- Trambauer, P., Dutra, E., Maskey, S., Werner, M., Pappenberger, F., Van Beek, L.P.H., and Uhlenbrook, S. (2014). Comparison of different evaporation estimates over the African continent. Hydrol. Earth Syst. Sci. 18.
- Veloso, A., Mermoz, S., Bouvet, A., Le Toan, T., Planells, M., Dejoux, J.-F., and Ceschia, E. (2017). Understanding the temporal behavior of crops using Sentinel-1 and Sentinel-2-like data for agricultural applications. Remote Sens. Environ. 199, 415–426.
- Weerasinghe, I., Bastiaanssen, W., Mul, M., Jia, L., and van Griensven, A. (2020). Can we trust remote sensing evapotranspiration products over Africa? Hydrol. Earth Syst. Sci. 24.
- Zhang, X., Chen, S., Sun, H., Pei, D., and Wang, Y. (2008). Dry matter, harvest index, grain yield and water use efficiency as affected by water supply in winter wheat. Irrig. Sci. 27, 1–10.
- Zribi, M., Baghdadi, N., Holah, N., and Fafin, O. (2005). New methodology for soil surface moisture estimation and its application to ENVISAT-ASAR multi-incidence data inversion. Remote Sens. Environ. 96, 485–496.